Learn about the New Dexalytics Reporting Feature
Reporting in sport has become a daily occurrence. Physical, technical, and tactical reports are shared and discussed every day to communicate with players, coaches and administrators/front office staff. The goal of the report is to make clear what has been done, and what may need to change.
The goal is generally to have reports:
- Quickly available
- Provide clarity to a specific question or aspect of training
- Have the flexibility to adapt to new questions or context from the people reading the reports.
A good report or analyses will usually drive more questions than it answers, since those reading it have a unique lens, and the critical component of context, from which they can dive deeper. In most cases, coaches or performance staff can explain variations within the data quite simply. But, in other cases, they may want answers to new questions or they may need to dive deeper. In these times it’s important to have flexibility with reports in order to quickly answer those new questions or deeper dives while you have those key stakeholders in the room.
Reporting should, in most cases, be quick and answers should be derived in a matter of seconds or minutes depending on the question. When we started designing our new Dexalytics Reporting Feature we had these principles in mind. We wanted to provide a flexible reporting tool that allowed users to efficiently describe the changes observed, but also efficiently change to meet new questions. Additionally, because we know that in some cases body composition is a sensitive issue, we wanted the ability to provide a very high-level view of positional or grouping changes that can show trends for a group or position of players.
Positional Reports
The images here depict a positional change report from our Dexalytics software. These reports allow you to quickly generate positional average change reports for any time period you choose for multiple body composition variables:
- Total Lean Mass
- Total Fat Mass
- Functional Shift (DTLM-DTFM)
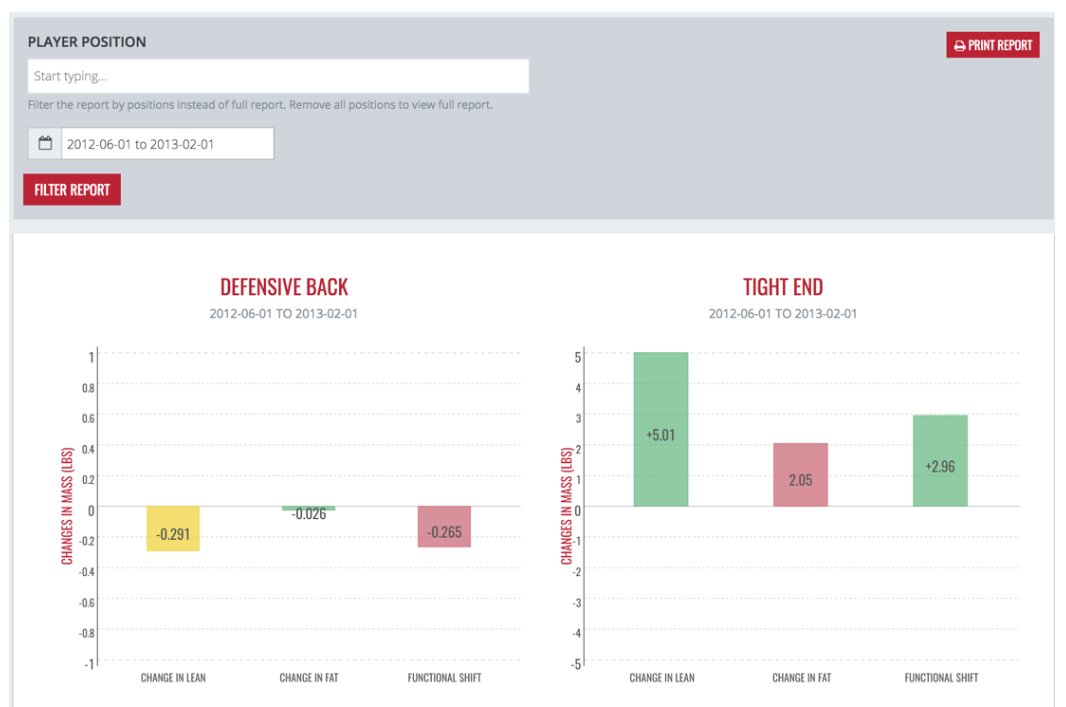


For the following example reports, we used football positions and took the time frame of June 1, 2012 to February 1, 2013. For most teams, this would include the changes that occurred during the competitive season with the June measurements serving as a pre-season scan through January being post-season. Depending on your scanning schedule, you may be able to narrow these dates closer to the start and end of the season.
Looking at the reports we can quickly see the variation between different position groups. TE, DL, OL, and RB had, on average, positive changes for both total lean mass and total fat mass causing a positive functional shift. However, DB’s and LB’s had negative shifts, with linebackers, on average, gaining almost 7 pounds of fat mass.
So this report that takes about 15 seconds to create and print if necessary identifies a potential problem that we can dig into deeper. We can start to identify potential differences between the LB group and the rest of the team. In some cases, maybe there were a few more injuries in that group. In others, maybe players were going through a training cycle that was focused on improving strength and gaining mass. Or, perhaps, a few players that didn’t play as much during the season didn’t modify their nutritional strategies. In most cases, the performance team will quickly be able to identify the problem, but the goal of reporting should be to quickly identify that there is a problem.
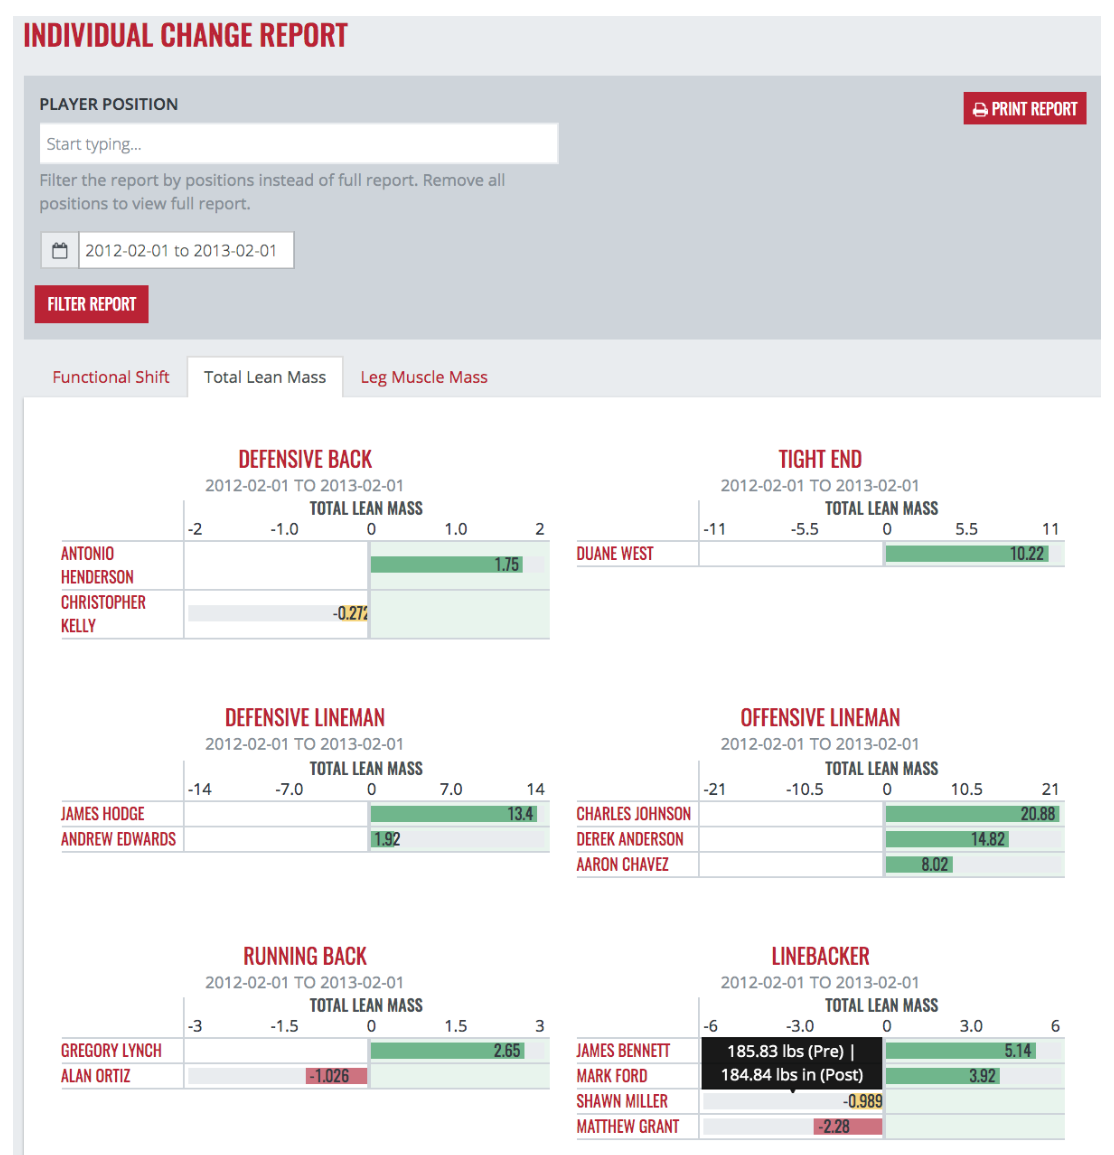
Individual Reports
Individual reporting allows for a deeper dive into the changes that occurred over any given period. We saw previously how the LB’s and DB’s differed from the rest of the positions. Taking a closer look with the individual reports allows us to see a little more information as to what is driving these changes. For DB’s we actually see that one player increased total lean mass, while the other one lost it.
This information adds an important layer of context to the positional report. Likewise, for LB’s, two players lost lean mass while one player gained lean mass. Using the online reporting tool you can hover over to see the pre- and post-measurement values.


This individual-level comparison can be very useful when discussing players with the whole performance team, as each group can provide insight into reasons these changes have occurred.
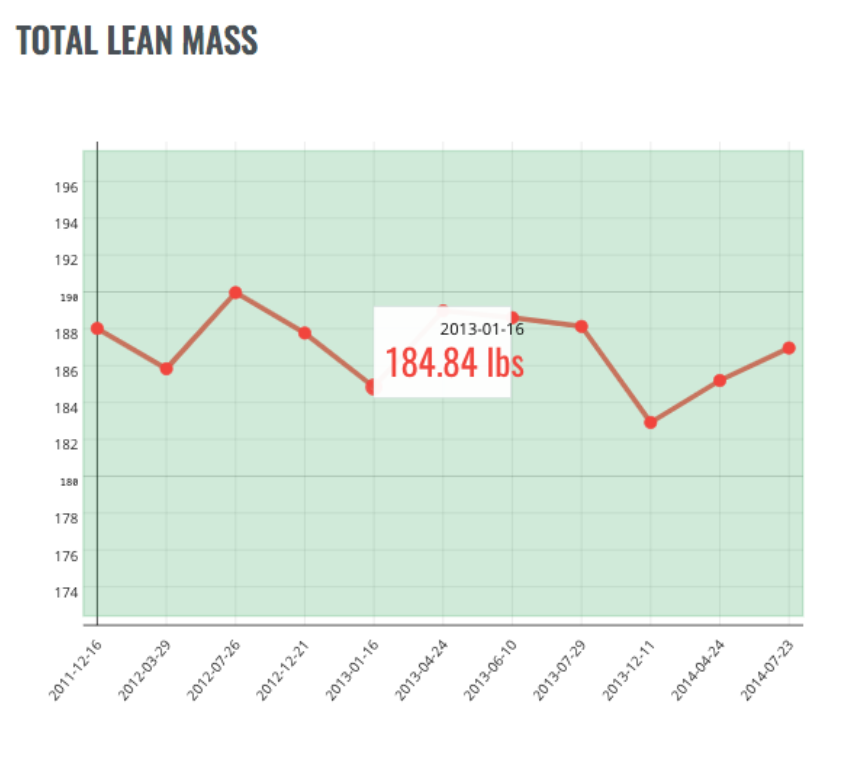
More importantly, these reports remain flexible in that new questions may be asked, such as, “Is this the normal fluctuation for this athlete? What did they look like in February of 2012? Do they always have this same drop during the competitive season?” Very quickly those questions can be answered.
The report below is showing the yearly change for this athlete from Feb 2012 – Feb 2013 and we see he lost a little less than a pound from this time last year. Importantly, using the previous information, we know he was up about 3 pounds of lean mass from Feb 2012-June 2012. So perhaps this drop is within that player’s norms. Looking at his individual longitudinal data below, we see he does tend to drop down in lean mass in the post season scan window. So this may be who this player is and be fine if they are performing well. Or, perhaps if caught sooner (after the 2013 scan) the drop in December 2013 could have been prevented.
Hopefully, this walkthrough of our new reporting feature has been helpful. We designed it with the goals of being efficient, informative and flexible to allow our users to maximize the time they have for solving problems and working with the athletes. If you would like to see this feature in action, set up a demo of our software.
About the Author: Tyler Bosch, PhD is a Research Scientist in the College of Education and Human Development at the University of Minnesota, and is a co-founder of Dexalytics.