A Comparison of Two National Football League (NFL) Players
One of the advantages of using dual X-ray absorptiometry (DXA) to determine body composition is that it can give you a measure of the total as well as regional body composition values. Most people assume that percent fat is consistent throughout the entire body, but the body tends to put on fat mass in different amounts throughout the body. Knowing the regional body composition can be very helpful in developing strength and conditioning programs. By using regional body composition, coaches, athletes and dietitians formulate programs for athletes based upon science instead of conjecture. Strength coaches can target areas that have access to fat composition data or can try and correct asymmetries in muscle mass. In this blog post, we will explore regional body composition differences measured via DXA and the importance of these measures.
Regional measures of percent fat (Percent fat)
Let’s take a look at a couple of DXA scans from two National Football League (NFL) players. Both players were starters for their respective teams and were Pro Bowl selections at their position.
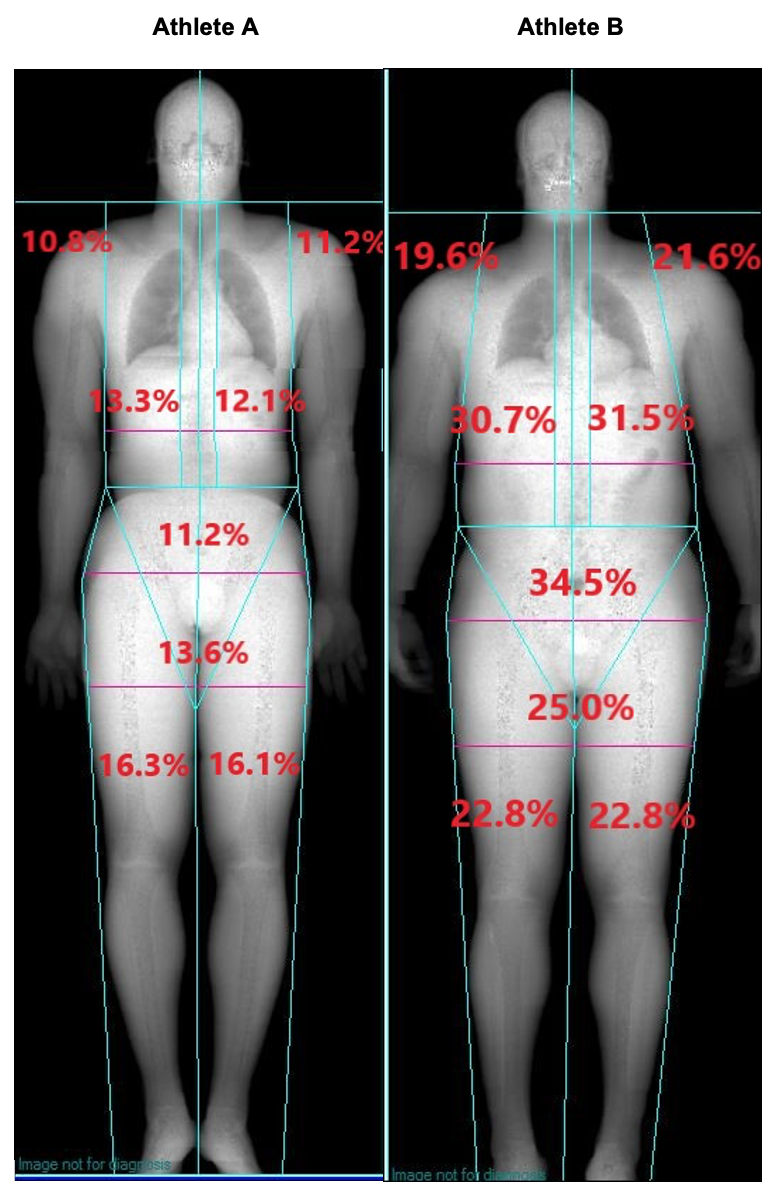
Athlete A was an NFL defensive lineman (edge rusher). It should be noted that this athlete played in a 4–3 defensive alignment where the defensive ends tend to be smaller than the defensive ends in a 3-4 defensive alignment. Athlete A was 76 inches (6 feet, 4 inches) tall and weighed 250 pounds and had a total percent body fat of 14.2% fat. This is amazing for an NFL defensive end, even for one who plays in a 4-3 defense. If you look at the DXA scan image for Athlete A below you will notice that he is not 14.2% fat throughout his body. Different areas of the body have higher percent fat levels while there are other areas in the body that are lower than the total percent fat value. For example, his right arm is 10.8% fat while his left arm is 11.2% fat, and both arms are lower than the 14.2% fat total body level. His right trunk area is 13.3% fat and his left trunk area is 12.1% fat. The android region (i.e., the area between the ribs and the pelvis) is 11.2% fat while the gynoid region (i.e., the region including the hips and upper thighs) is 13.6% fat. Athlete A’s legs have the greatest percent fat values with his right leg being 16.3% fat and his left leg being 16.1% fat.
Now let’s look at Athlete B, who is also 76 inches tall and weighs 250 pounds. Athlete B has a total percent fat value of 26.3%. You may be surprised to know that Athlete B is a quarterback. Compared to Athlete A, Athlete B is carrying a lot more total body percent fat. Like Athlete A the percent fat varies around the body for Athlete B and he has a higher degree of variance in percent fat than Athlete A. Like Athlete A, Athlete B has a lower about of percent fat in his arms compared to his total percent fat value. His right arm is 19.6% fat while his left arm is 21.6% fat. Unlike Athlete A, Athlete B has a lower amount of percent fat in his legs compared to his total percent fat value. His right leg is 22.8% fat while his left leg is also 22.8% fat. For Athlete B his trunk region is where the largest amount of his fat is carried. His right trunk is 30.7% fat while his left trunk region is 31.5% fat. The percent fat in the android region for this player is 34.5% fat while the percent fat in the gynoid region is 25.0% fat. Obviously, this athlete is carrying a lot of his body fat in the abdominal region, which is not a healthy area to be carrying excess fat.
Ways to use regional measures of body composition
You may be saying to yourself this is interesting, but how do I use this data to help myself or my athlete. So let’s take the data from our two athletes and discuss how we would use it. In looking at Athlete A you see a player who has very low body fat and the fat is distributed pretty evenly on this frame. Depending on how this player is being used in the team’s defense a coach might want him to add more weight. The team’s strength coach and the dietitian may work together to develop a plan to have him increase his calorie intake and continue this strength and conditioning program, which is obviously working in terms of keeping his percent fat low and balanced throughout this body. The coach and the dietitian may want additional DXA scans to monitor the increase in body weight to make sure that the majority of this weight gain is muscle and not fat. Remember Athlete A is playing at a Pro Bowl level so the coaching staff may decide that the player is right where they want him and just want to continue everything (strength and condition program, diet program) as it is. He is primarily an edge rusher and additional weight may slow him down. Future DXA scans can be used to monitor the player to make sure that he continues his current program.
Athlete B presents the coaching staff with a different sort of issue. Clearly, Athlete B is carrying an excess of body fat as evidenced by the higher proportion of fat in the abdominal region. Showing Athlete B his regional DXA scan report might help demonstrate this point to the athlete. The dietitian could work with the athlete to limit his caloric intake to assist in a program of weight loss. The strength coach may work on a strength and conditioning program that targets core muscles in the abdominal region. Future DXA scans can be used to track the progress of the new diet and strength program. Using these new regional DXA scans, the dietitian may alter the new program if the weight loss is not occurring or the weight loss is occurring too fast and Athlete B is losing too much muscle mass. Now Athlete B may argue that he is playing at a Pro Bowl level so why change? The coaching staff may point out that the reduction in weight and fat mass may make him more mobile and able to elude pass rushers. In addition, the loss of access weight, especially fat weight, may take the unneeded weight off of his leg joints and may prolong his career.
Final thoughts on measures of regional body composition
Obviously, there are a number of ways to use regional measures of body composition beyond the examples I have presented in this blog. The regional composition can be used to look at muscle asymmetries from the right side to the left side. The use of regional measures of body composition can also be used to examine upper to lower body ratios or other sports-specific ratios. Finally, they can be used to examine muscle loss due to injuries.
About the Author
Donald Dengel, Ph.D., is a Professor in the School of Kinesiology at the University of Minnesota and is a co-founder of Dexalytics. He serves as the Director of the Laboratory of Integrative Human Physiology, which provides clinical vascular, metabolic, exercise and body composition testing for researchers across the University of Minnesota.